By Lauren McCarthy
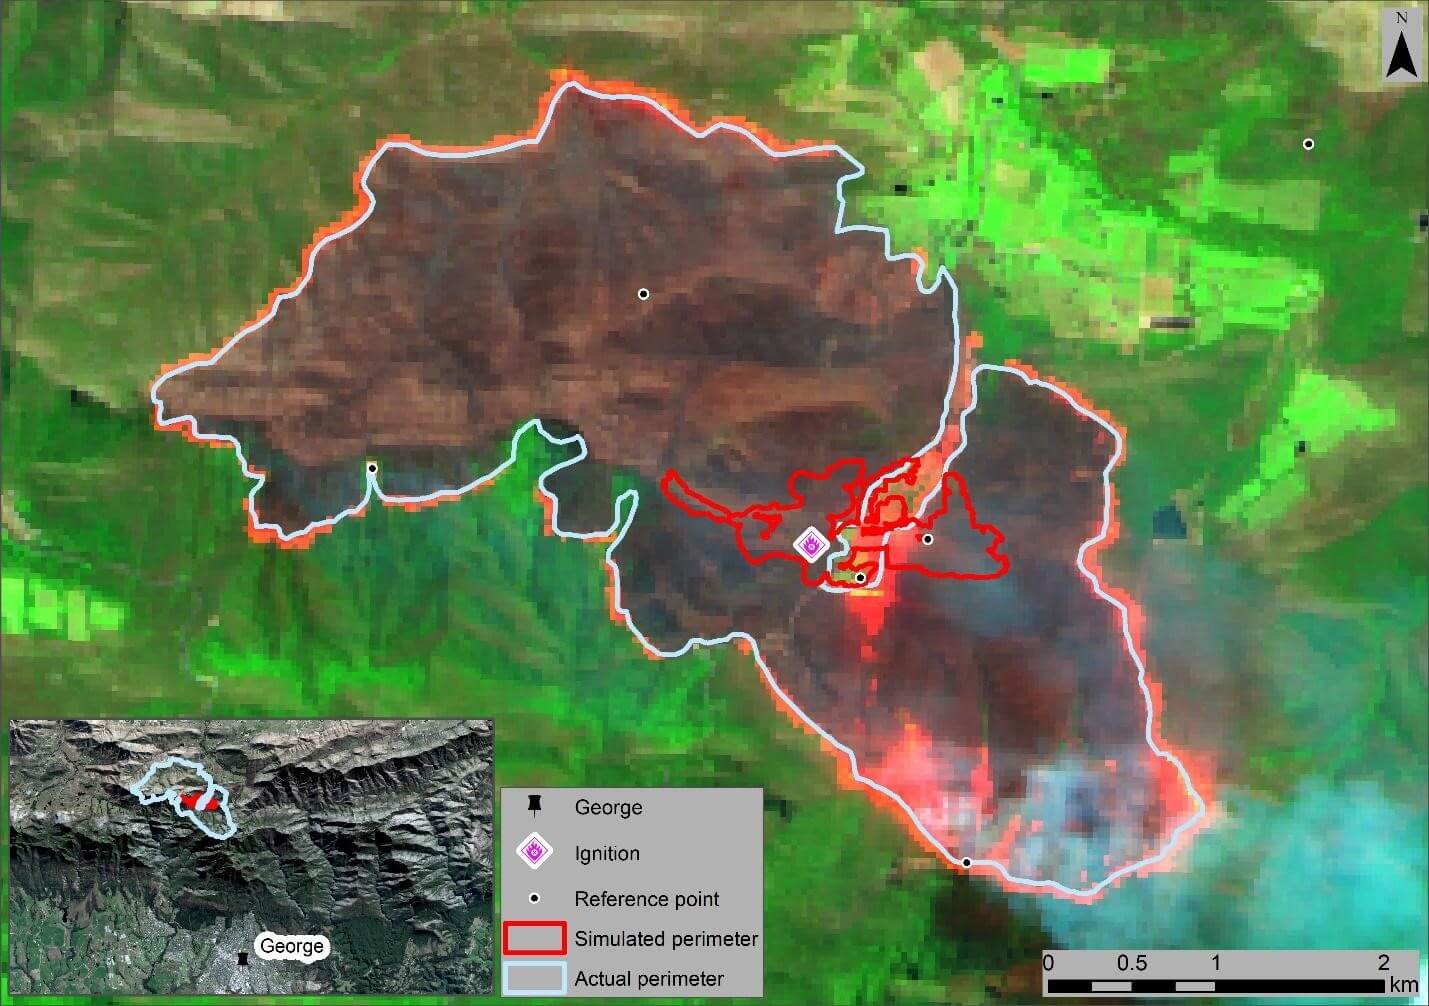
Wildfires occur globally, destroying thousands of hectares of vegetation, affecting ecosystems, the environment, and humans. Fire spread models, based on fire behaviour algorithms, have been developed in different regions to aid researchers in better understanding fires and fire-management teams in fighting the fires and making important decisions. One such model is the Prometheus: Canadian Wildland Fire Growth Simulation Model. This paper investigated whether the Prometheus model could be implemented to predict fire spread and to assess the accuracy and limitations of the model based on data from a fire that occurred near the town George, Western Cape, South Africa, in October and November 2018. An ignition source, weather, land cover, and elevation data for the fire event were obtained. Land cover data was matched to the Australia-Tasmania fuel-types for use as fuel-type input and all of the datasets were formatted using Geographical Information Software and input into Prometheus. Two simulations were run, the first for the 25th of October 2018, one day after the fire started, and the second for the 9th of November 2018, the full time period of the fire. The model outputs were compared to Sentinel-2 derived burn scars from the same dates. The first simulation (Figure 1) underestimated the burn area (68.55 Ha simulated vs 1 368.94 Ha observed) and the second simulation (Figure 2) over-estimated the burn area (303 460.09 Ha simulated vs 80 293.52 Ha observed).

Figure 1 Predicted vs actual spread on the 25th of October 2018. The simulated perimeter is red, and the actual perimeter is light blue. Reference points used for the accuracy assessment are black dots with a white outline. The Sentinel-2 image, captured on 25 October 2018, is displayed as a Red, Green, Blue image where Red = Band 12, Green = Band 8A, and Blue = Band 4.

Figure 2 Predicted vs actual spread on the 9th of November 2018. The simulated perimeter is red, and the actual perimeter is blue. Reference points used for the accuracy assessment are black dots with a white outline. The Sentinel-2 image, captured on 9 November 2048, is displayed as a Red, Green, Blue image where Red = Band 12, Green = Band 8A, and Blue = Band 4.
Sorenson’s coefficient (SC) values for the simulations were 0.13 and 0.33, respectively. The results showed that the model corresponds poorly with the observed fire spread on both dates. The results suggest that Prometheus may underestimate the spread rate in specific vegetation types in this scenario while overestimating the rate of spread in others (Figure 3).

Figure 3 Percentage of land cover types that were predicted to have burnt and actually burnt on the 9th of November 2018.
In the future, incorporating fuel-densities, adapting fuel types for South African vegetation types and incorporating the interaction between wind and topography of the area may improve Prometheus fire spread model predictions.
Biography
Lauren has been employed at the CGA in a part time capacity as a Data Capturer since June 2018. Lauren completed a BSc in Geoinfromatics in 2018 and Honours Geoinformatics in 2019. Her responsibilities include quality control on various projects, digitizing, DEMSA2 editing and helping where needed. Lauren’s interests outside of the CGA include spending time with friends/family, sewing and exploring Stellenbosch.
