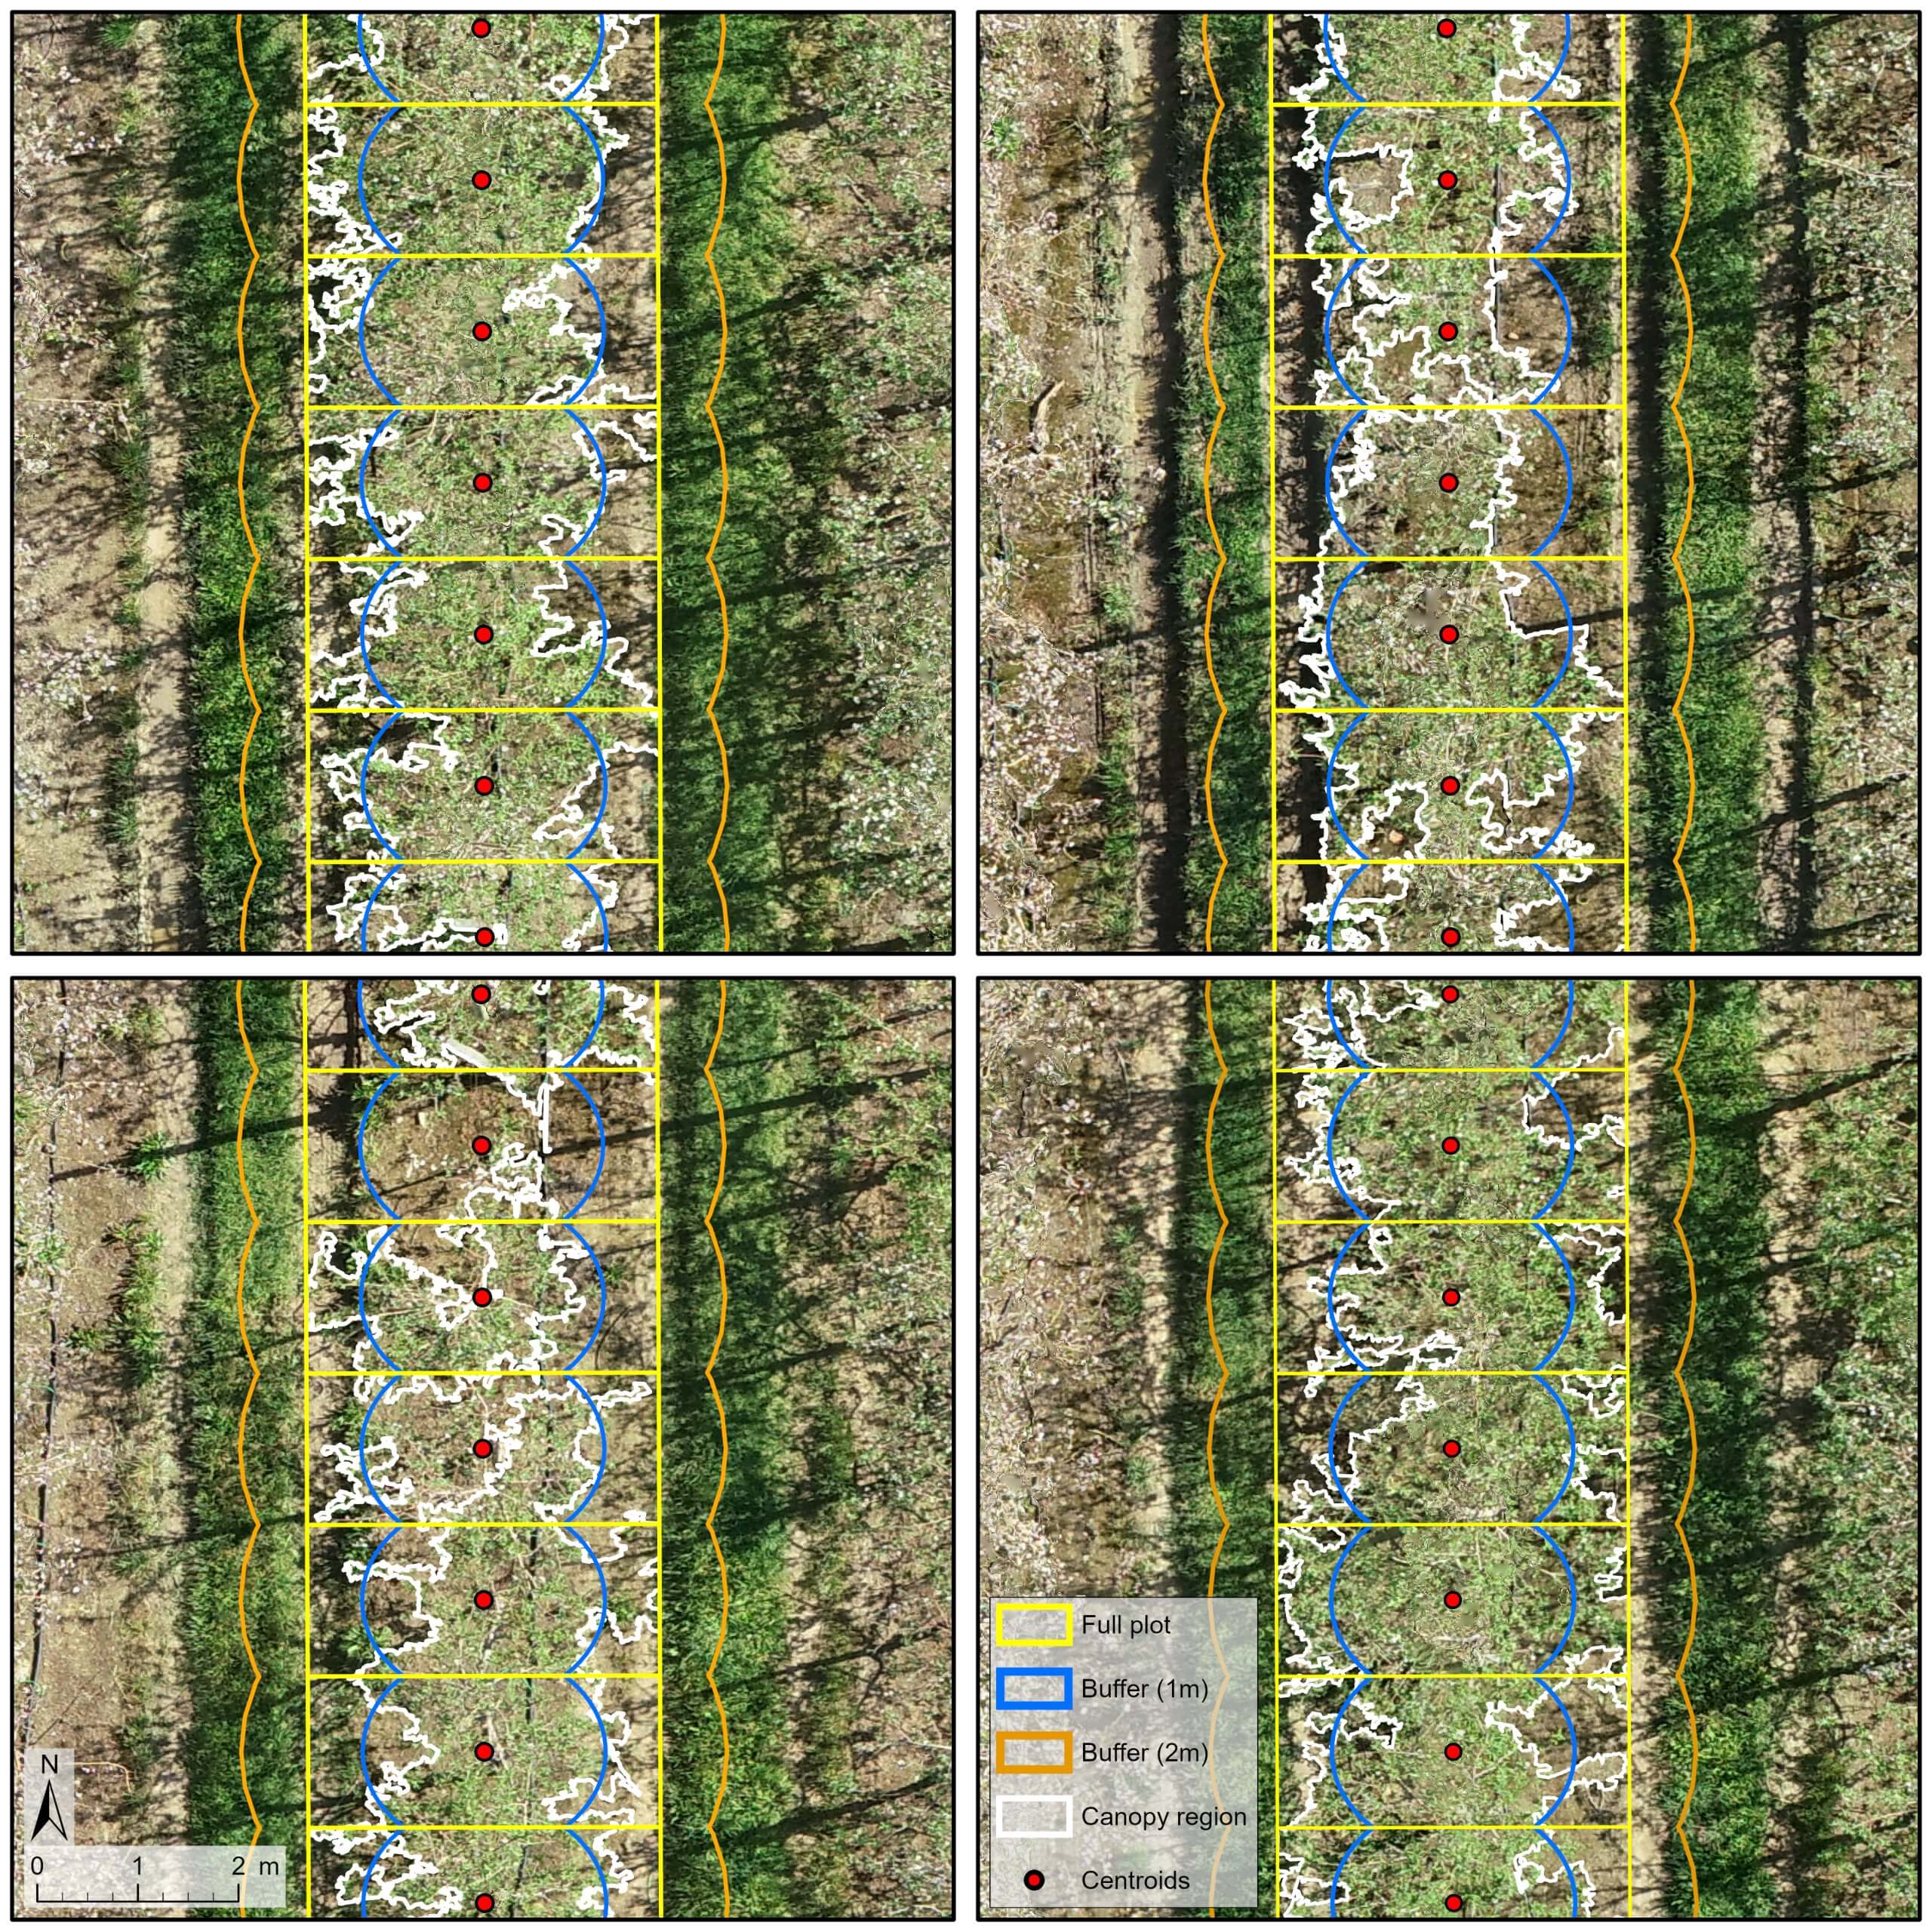
Drone imagery is often used to calculate vegetation indices such as the normalized difference vegetation index (NDVI) to characterize the condition of individual trees in orchards. Individual trees are often defined as a centroid (centre of the tree), or a circle (buffer around the centroid) or a rectangular area (plot). The NDVI values are then extracted for these entities and used in decision making. Using a centroid is risky as it makes use of a single pixel’s value, which might not reflect the conditions of the rest of the tree. Using a circle is better as the mean NDVI value of all the pixels in the circle can be calculated. However, if the buffer is too small, the branches of the tree might be excluded and if it is too big, background information (e.g. weeds and cover crop) might contaminate the NDVI signal. The plot approach (yellow lines in the image below) is popular as it covers most of the trees, but is heavily affected by background signals.
A better approach would be to regionalize the trees to separate (and discard) the background from further consideration. The image below shows the result of such a regionalization (white lines) that was applied to an apple orchard during bloom. The procedure makes use of image segmentation, a combination of vegetation indices (derived from an RGB image), thresholds, and post-processing to delineate the canopy regions.

Acknowledgements: This work forms part of a project funded by Hortgro. The drone imagery was provided by Agrimotion.
