Mixed methods research and data analytics
The tracking of all activities allows for big data analysis and for quantitative, qualitative and mixed methods research studies to determine whether the goals of optimizing performance, experience and development were met.
Apart from the profile data of each member, we also have a complete record of his/her interactions with the system: assessment scores, answers to the workshop exercises, e-journaling entries , user generated content for the conditioning programs, data from the member's collection of "trackers", data from the gamification process (e.g. points, levels, leaderboard positions), personal reflections about the system, etc. It is thus clear that a huge amount of valuable data very quickly builds up. We are using a combination of quantitative, qualitative and mixed methods research methods to mine this data in order to measure the impact of our memberships on the performance, experience and personal development of our members. Data analytics provides us with more insights about our members and what factors make a difference for them, for example in their area of performance.
The diagram below shows examples of the outomes we are aiming for with our mixed methods research methodology and analytics approach in terns of performance, development, experience and "wisdom" for each of our three focus areas, namely education, the world of work and sport. A short explanation/description of each outome per focus area are provided below the diagram.
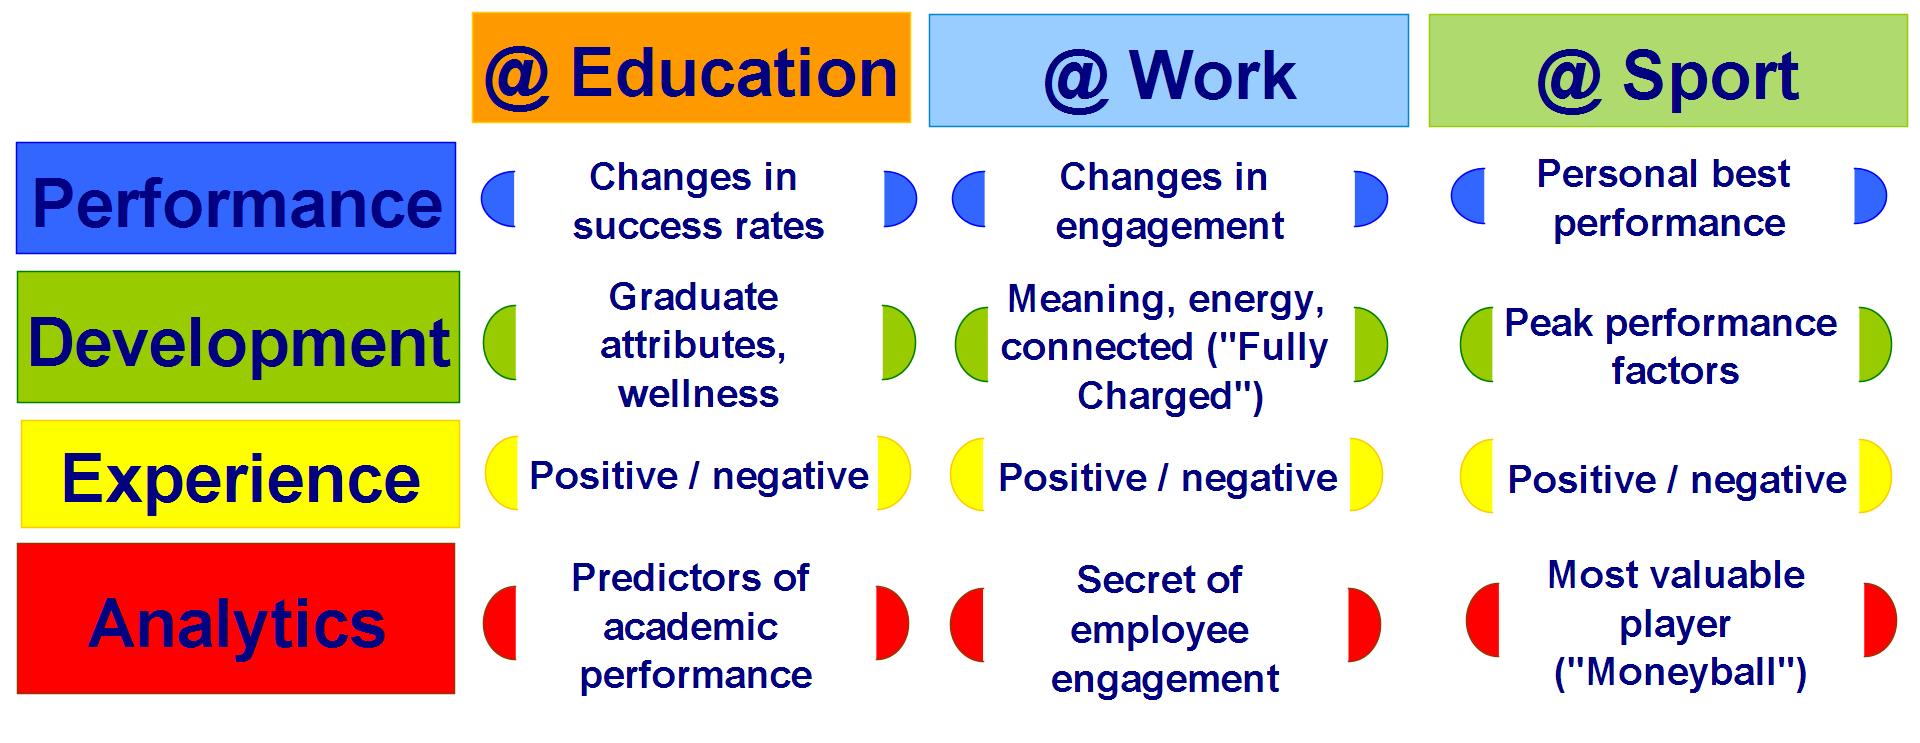
For an educational membership we typically want to determine whether a positive change in success rates occurs (performance), whether the members (students) have grown in terms of specific graduate attributes, or another desired outcome like wellness (development) and whether they enjoyed the experience or not. Quantitatitve, qualitative and mixed methods research tools are utilized to measure these three outomes. A meaningful application of data analytics within this environment is to identify "non-academic" predictors of academic performance, and to use this information to further improve the developmental resources offered to the membership. To perform analyses like these require high level skills, e.g. knowledge and skills to use a package like Dedoose (for the mixed methods stuff) and a package like NeuroIntelligence (to do some of the data analytics), as well as TIME (especially for the qualitative analysis). Click here to learn how this process is being performed at Stellenbosch University where it is applied to measure the impact of the BeWell Mentor Wellness project.
For a FlourishWell4Life @ Work membership we want to know if engagement levels were impacted positively (engagement influences productivity, performance, happiness at work, etc.), if the members experienced growth in terms of their energy levels, their connectedness to other people (positive relationships) and the meaningfulness of their work (are they "Fully Charged" to use the language of Tom Rath!), and also if they enjoyed the membership (positive verus negative). Data analytics can be used to identify the secret factors of employee engagement within the specific working context of the membership that is being investigated.
Within a FlourishWell4Life @ Sport application a combination of quantitative, qualitatitve and mixed methods research methodologies can be used, amongst others, to determine personal best performances, to establish whether members have grown in terms of the peak performance factors that are required for their sport and to assess whether their membership was a positive or negative experience. An excellent data analytics application is determining the most valuable player (MVP) - think "Moneyball" (the movie about a basketball manager that employed a data analytics expert to assist him in recruiting a winning team with a small budget).
Please use the menu at the top to navigate to other pages.
Life is too short not to shine on your journey!